G2/G3/G4 Topics
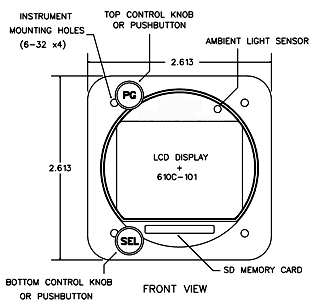
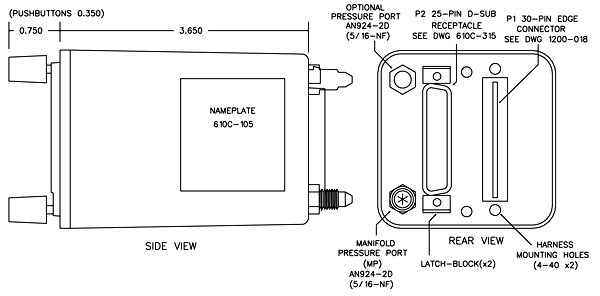
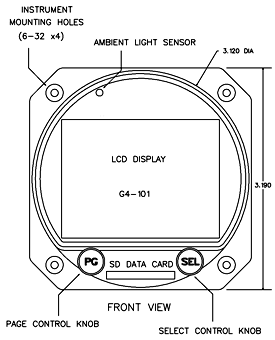
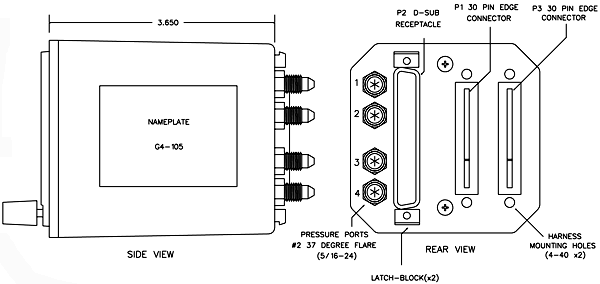
- Question 1, What is the size of the G Series Engine Monitors?
- Question 2, What is the difference between "Live G Force" and 2-axis turbulence screen?
- Question 3, What is file system on your SD card?
- Question 4, Oil temperature placement?
- Question 5, Insight Warranty?
- Question 6, Instrument Length with connector?
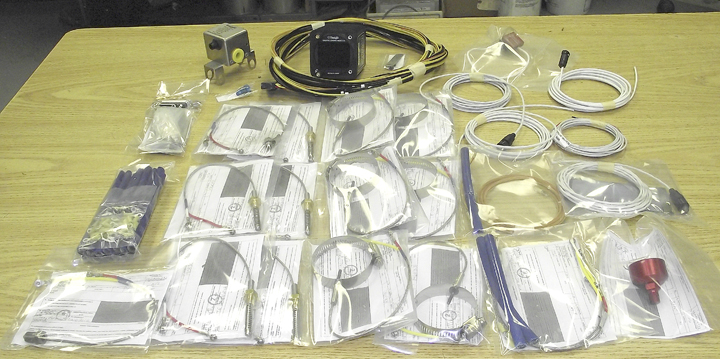
- Question 7, What is in a G3 kit?
- Question 8, Where to install TIT probe?
- Question 9, Different lean box color?
- Question 10, G Series uses 24 hour clock?
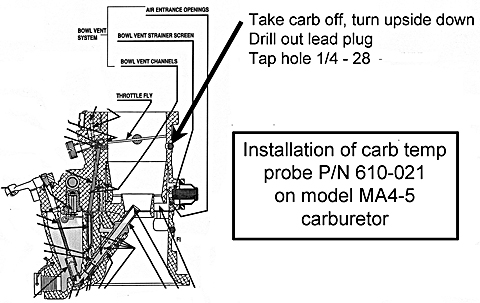
- Question 11, Cessna Carburetor MA4-5?
- Question 12, How to set configuration page on G3-G4?
- Question 13, Check brightness?
- Question 14, How to set Total Fuel?
- Question 15, About Buss voltage?
- Question 16, Setting GPS interface?
- Question 17, Graphing flight data?
- Question 18, How to graph data Video?
- Question 19, FFT setting and leaning question?
- Question 20, Monitor troubleshooting?
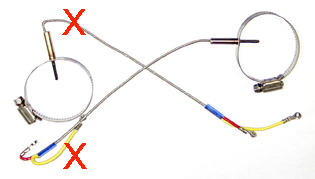
- Question 21, Wiring harness warning?
- Question 22, Do not over bend probes?
- Question 23, Good grounding on aircraft?
- Question 24, Checking D-Sub Connector?
- Question 25, Ferrite Suppressor?
- Question 26, Airframe ground?
Q. What
is the difference between the new "Live
G Force" screen
and the vertical component of the 2-axis turbulence screen? It seems both are displaying the vertical
component in Gs.
A. The TWO AXIS TURBULENCE screen displays the G force in the vertical axis and in the yaw axis simultaneously on one screen. The VERTICAL AXIS component of this screen samples the G force in the vertical axis once per second and displays the sampled value with an accuracy of three decimal points. The sampled value is plotted on a graph with a fixed scale that ranges from +2 Gs to -2Gs. As a result this fixed scale and fixed resolution small values are not easily discernible.
The latest version of the software for both the G3 (version 284) and the G4 (version 159) includes a new feature where the G3/G4 samples the G force in the vertical axis ten times a second. If the actual G force is ever outside the acceptable range, as defined by a user selectable threshold, then the G3/G4 will automatically save a snapshot of the G force. The last snapshot taken is available for viewing directly on the G3/G4. Several possible conditions (e.g. rough turbulence, hard landing, or a steep turn) can trigger this automatic save.
The pilot can set the G force threshold to any value from 0.2 Gs to 2.5 Gs in increments of 0.1 G. The default the value is 1.0 Gs. The most sensitive setting is 0.2 Gs. At this setting the G force must be within plus or minus 0.2 Gs or a snapshot will be saved.
If the G force exceeds the threshold then the G3/G4 will record not only the one value that triggered the capture but also all the sampled values of the G force for a twelve second period.
This period consists of six
seconds before the event and six seconds after the event.
The one hundred plus samples of the G force provide the pilot or AP mechanic with valuable information from both before and after the event.
The data from the last triggered snapshot is available on a new page entitled “LAST TRIGGERED SNAPHOT”. The live G force data is displayed on a new page “LIVE DYNAMIC G FORCE”.
These pages display the data graphically so you can tell at glance what is going on without having to wait for the data to get transferred to a computer.
The graphs auto scale based on the G-force threshold-providing maximum zoom for easy viewing.
 Do Not Save Flight
Data Excel files back on to the SD Card - Save them to your
computer!
Do Not Save Flight
Data Excel files back on to the SD Card - Save them to your
computer!
If you lost the SD card. (Has to be a 2 GB SD card)
Fast track method - Use the SD card that came with your instrument or buy another SD Card from us.
Or do the following
If the file system on your SD card has become corrupted you can
reformat the card with the attached utility. Alternatively you
can download the latest version from the following site.
http://panasonic.jp/support/global/cs/sd/download/index.html
Need format SD Card manual - Click Here
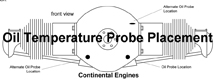 Oil
Temperature Probe Placement PDF
Oil
Temperature Probe Placement PDF
|
Insight Warranty
a) All warranties begin from Date of
Purchase from Insight
Instrument. |
|
b) Two Year Warranty - TAS 1000, Strike Finder and TF 500. |
|
c) One
Year on G1, Two Year on G2, Three Year
on G3 |
|
d) One Year Warranty or 1000 Hours
(whichever comes first) -
Probes/Harnesses/Sensors. |
|
e) 90 Days - Refurbished Units or
Repaired Units. |
|
f) Insight Instrument covers outgoing UPS
Expedited, shipping services. |
|
g) Warranty coverage’s are determined by the Insight Technician only. |
Aircraft install weight - A G3 for 6 cylinder with 8 foot harness, all sensors, wiring, connectors and probes. - 4.2 Lbs.
Here is a G3 Kit 7
Here's a photo of the aircraft turbo exhaust inlet.
Beech F33A (19xx) with IO-550-B Turbo Flite 550
(turbo normalized).
Installation of the GSeries engine monitor - Need to know TIT probe optimum location.
Answer
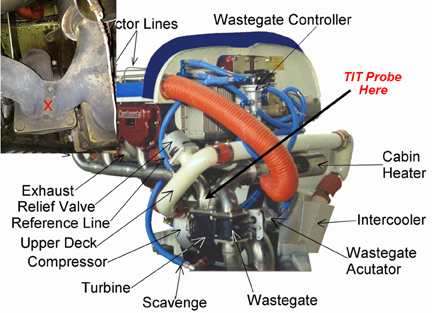
 Turbine
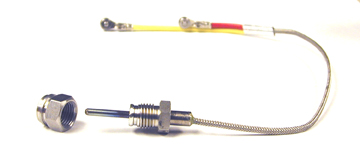
Inlet Probes (TIT)
Turbine
Inlet Probes (TIT)
TIT Probe 7/16" - 20 P/N 2872 Threaded with boss
K-Type thermocouple Red/Yellow in Yellow
Question
I have the G-3 in my Beech Bonanza IO-550 and sometimes when mixture is leaned, the boxes indicating the # leaned (i.e. L50, L40, L35 etc) are not in same color. Some are white, blue or black. What does the difference in color mean?
Answer
During the leaning process as each cylinder peaks the G3 records
- The temperature at which that cylinder peaked.
- The fuel flow rate (FF is the total for all cylinders) at the time that cylinder peaked. This FF rate is displayed just below the top of the EGT bar.
After a cylinder has peaked the FF now is compared with the FF when that cylinder peaked. If the FF now is less than the FF at peak then this cylinder is said to be running lean of peak (LOP). If the FF now is greater than the FF at peak then this cylinder is said to be running rich of peak (ROP).
An L in the box means lean of peak and an R means rich of peak. The number after the L or R is number of degrees that this cylinder is lean of peak or rich of peak.
If the cylinder is running LOP then the outlined box, the letter L, and the number after the L are displayed in white. If the cylinder is running ROP then the outlined box, the letter R, and the number after the R are displayed in cyan (blue).
There is also a user selectable threshold. The default value of this threshold is 25 but the user can select any value between 10 and 150. To set the threshold from the main screen press the SEL button two times. At the bottom of the screen the G3 displays the current threshold. Turn the SEL knob clockwise to increase the threshold or counter-clockwise to decrease it. Press the SEL button a third time to save it.
If the threshold is reached or exceeded then the box changes from an outline to a solid box and the letter L or R and the numbers after it are displayed in black.
If we are below the threshold a white outlined box means lean of peak, a blue (cyan) outlined box means rich of peak. If we reach or exceed the threshold a solid white box means lean of peak, a solid blue (cyan) box means rich of peak.
Answer
The G3 uses a 24 hour clock so there is no actual AM/PM selection but you can change the date and time to whatever you want.
Here's how you set the date and time on the G3
1. With G3 powered off
2. Press and hold the top button of the G3
3. Turn on the avionics power (do not release the top button yet)
4. After several seconds you can release the top button (you should be on the REGISTRATION CONFIG screen)
5. Turn the top knob (either clockwise or counter-clockwise) until you get to the SET DATE/TIME screen
6. Press the bottom button to select one of the year, month, day, hour, minute, or second (the selected line is YELLOW)
7. Turn the bottom knob to change value of the selected item.
8. Select UPDATE TIME NOW and turn the bottom knob to YES (YES will be RED if selected)
9. Press and hold the bottom button to save the new time (and date).
Carb temp probe P/N 610C-021 installation instructions.
Here is the manual for the Model MA4-5 Carburetor - Click
Here ![]()
Here is the location below
Configuration Page of the G3/G4
I was "messing around", on the Configuration Page of the G3 trying to reset the brightness to the maximum setting, (which I assume is 15), but not sure if in the scrolling around of the other settings I did not accidently reset those to less desirable setting. So find below what my settings show now and please let me know if they sound about right to you. I own a Beech Bonanza V35B with a non-turbo IO-520BB engine.
1) I have the brightness set to 15 which I assume is the maximum setting?
2) EGT Autorange is ON. Is this the best setting to get useful EGT information?
3) Autorange
Inflection is set at 1100. (I
have no idea what this function is??)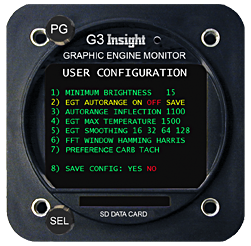
4) EGT Max.Temp; is a set at 1500, which I think is just fine. Does this automatically set my CHT to 400? If not, how can I find what is my CHT alert setting?
5) EGT smoothing; of the four choices it is currently set at 32. Is this a good setting and what effect do the other settings have on the monitor.
6) FFT Window; is set on the HAMM option. Again is this the most useful or usual setting and what does HARR and FLAT do to the read outs? And what is FFT?
7) Preference; has two settings Carb and Tach, and appears to have three options; select Carb, select Tach, or select neither (in which case both Carb and Tach remain yellow). Is this correct? I believe it was set up with both Carb and Tach de-selected, (i.e. both yellow). Since the engine is fuel injected, I assume we don't want Carb selected, but was not sure about Tach?
8) Also, I have noticed a new TAS 1000 Air Data page. However, so far of all the data on this page, it is only providing the OAT data. Is the rest going to be functional in a future software update??
First of all, before addressing each individual
item, please note that you can restore your G3 to
its original factory default settings. Resetting to
defaults will not affect things like aircraft
registration number, aircraft type, model number,
engine type, owner name, phone number etc. It will
also not affect things like number of cylinders,
number of TITs, injected or carbureted, etc. To
restore factory defaults select YES on the FACTORY
DEFAULTS line, and then select YES on the SAVE
CONFIG line in the REGISTRATION CONFIGURATION
screen.
1. The
brightness setting is actually a MINIMUM brightness
setting. The G3 has an infrared sensor which
measures the brightness of the ambient light. The G3
controls the LCD backlight brightness based on
current lighting conditions. Adjusting the minimum
brightness over rides this automatic feature to
prevent the display from going dimmer than your
chosen value. The values range from 1 to 15, with 15
being the brightest setting. The default setting is
5.
2. Setting
EGT AUTORANGE. With this set to OFF the height of
the EGT bars is based entirely on the value of the
EGTs. With it set to ON the height of the EGT bars
may be stretched to use the height of the screen.
Setting this to ON or OFF is a personal preference.
It only affects the appearance of the EGT bars on
the main screen.
3. AUTORANGE
INFLECTION. Here the user specifies the point above
which the stretching occurs. Say, for example, that
the the inflection point is set at 900 degrees F.
Here EGT values below 900 do not significantly
affect the EGT bar height but EGT values above 900
do. Again this only affects the appearance of the
EGT bars on the main screen. It does not affect the
numeric values displayed or the values recorded in
the log file.
4. EGT
MAX TEMPERATURE. This is unrelated to any cylinder
head temperature (CHT) alert setting. The red line
for CHTs is fixed at 460 degrees Fahrenheit. If the
CHT reaches or exceeds 460 the CHT bar will be
displayed in red. The yellow line is currently fixed
at 50 degrees below red line. So when the CHT is
between 410 and 459 the CHT bar will be displayed in
yellow. Below 410 the CHT bar is displayed in green.
5. EGT
SMOOTHING. Cylinder head temperatures change very
slowly due to what is called thermal mass. Exhaust
gas temperatures (EGTs) on the other hand can change
very rapidly. To prevent these numbers from changing
so fast that they are not easily readable the G3
smoothes them out by averaging them. You can think
of the value chosen as the number of samples in the
average. The default is 32.
6. FFT.
FFT is an acronym for Fast Fourier Transform which
is an algorithm used in the vibration analysis. Here
we allow the user to choose one of HAMM, HARR, or
FLAT for the FFT window. These refer to Hamming,
Blackman-Harris, or flat top window. This is a very
technical subject and in most cases the average user
does not need to change this. However we make these
choices available for the user who is very familiar
with FFT. If this is not the case then you can just
use the default setting of Hamming.
7. CARB
or TACH preference. On a G3 there is room for six
pieces of numeric information at the top two lines
of the main screen. If your aircraft is fuel
injected then RPM is displayed in the middle of the
top line. If your aircraft is normally aspirated
then you have the choice of displaying either RPM or
CARB temperature in the middle of the top line. On
line 7 of the user configuration screen you specify
your preference. Your choice is displayed in RED. On
all lines that provide a choice of two or more
items, the user has the option of selecting any one
of them, or selecting none of them. If he selects
one his choice will be displayed in RED. If he
selects nothing the entire line will be either GREEN
or YELLOW depending on whether or not the line is
selected. If the user does not specify a choice the
G3 will use a default value. If the aircraft is fuel
injected the default value will be to display RPM.
If the aircraft has a carburetor the default value
will be to display CARB temperature.
8. TAS1000
page. This page has been functional since August
2012 in software version 217. It displays a subset
of the information received from a TAS1000 or
comparable air data computer. If you don’t have one
of these connected your G3 cannot display the
missing information.
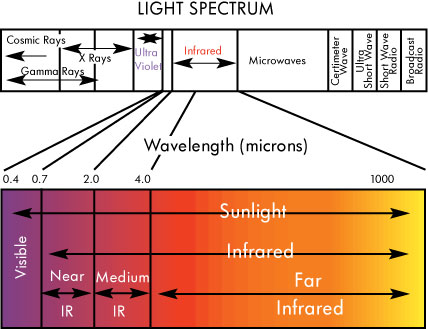
NOTE: To check brightness, use incandescent light source to shine on GSeries instrument face.
LED and fluorescent will not work because of the lack of infrared in the beam.LED and fluorescent have narrow wavelength - See charts
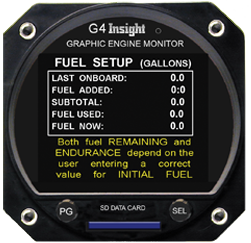
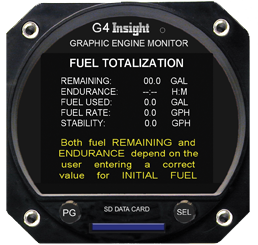
NEW Fuel Screens
Now the selected line is yellow and the inactive lines are white.
YES/NO in red has been removed by displaying only the word YES or the word NO in green, when saving.
When there is a choice of several items the selected item is displayed in green.
Exactly one item is always selected.
The choices of temperature units are Celsius or Fahrenheit then either Fahrenheit or Celsius will be selected in green.
• The FUEL TOTALIZATION screen has been improved and is even easier to use.
This change allows the pilot to see this screen before entering fuel on board.
Also setting initial fuel can be checked and corrected in flight.
Previously the pilot had to enter the amount of fuel onboard before he could view the FUEL TOTALIZATION page.
Now both the FUEL TOTALIZATION page and the FUEL SETUP page are accessible at any time.
On the FUEL TOTALIZATION screen simply press the PG (left) button to enter fuel, press it again when done.
As before you can top up the tank(s) by turning the SEL (right) knob counter clockwise on the very first click.
Your G2-3-4 was preset at factory with your usable total fuel
To reach FUEL TOTALIZATION screen from the main screen.
Turn the PG knob counterclockwise one click.
Push PG knob to go back and forth between the FUEL SETUP and FUEL TOTALIZATION screens
On FUEL SETUP screen setting fuel gallons the lines FUEL ADDED, SUBTOTAL and FUEL NOW color will be yellow.
Turn SEL knob to set gallons (Clockwise or Counterclockwise one click for total preset total fuel for your aircraft)
At anytime you can push PG knob to go back and forth between the FUEL SETUP and FUEL TOTALIZATION screens to add more fuel.
The G2-3-4 Buss Voltage attempts to display the buss voltage in green when it’s normal and red when it’s outside of normal. In an aircraft with a 12V electrical system the Buss Voltage will be annunciated in green so long as the voltage is 12.0V to 14.9V (inclusive).
In an aircraft with a 24V electrical system the Buss Voltage will be annunciated in green so long as the voltage is 24.2V to 28.7V (inclusive). Below this range the alternator isn’t charging the battery and above that it’s overcharging, and the Buss Voltage will be annunciated in red.
The instrument must be connected to the main voltage buss
(not in series with something else, on a lighting buss, etc)
and must have a good low-resistance ground connection,
otherwise the voltage measurement itself will be in error
causing the Buss Voltage to indicate in red erroneously.
NOTE: For GPS interface you must have software Version UPDATE: 185 or higher in G3
NOTE: Please refer to your GPS MANUAL for correct pin outs and connection information (PIN 57 for 430)
EXAMPLE -
INSTRUCTIONS FOR GARMIN 430 SERIES SOFTWARE SET UP:
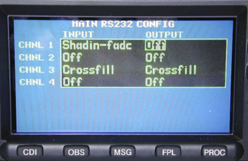 1) To
start set up mode.
1) To
start set up mode.
Press
and hold “ENT” button and apply power.
Hold
“ENT” until the display lights up.
Release
“ENT” button, wait until display says OK
Press
“ENT” button once.
2) Turn
inner rotary knob until “Main
RS-232 Config” appears.
3) Use
cursor and “ENT” button to select.
4) Press
cursor button to select input for channel 1
INPUT
Channel
1 Shadin
- fadc
5) Turn power off.
To view and graph your G3/G4 logged vibration data this Excel file will help.
Click on Excel file and follow instructions.
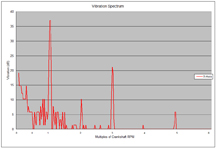
Insight G3/G4 Vibration Log Graph Tool (V1.14) - Click Here
 G 2-3-4 "How
To" Graph Your Flight Data Video -
Click Here
G 2-3-4 "How
To" Graph Your Flight Data Video -
Click Here
1. On the Configuration page, there is a line for "FFT," with three possible settings. I'm assuming this setting concerns the vibration page and use of the Fast Fourier Transform algorithm? I've poured through the installation and operating manuals and cannot find any information about this setting, what it does, or how to optimize it for my aircraft. Please advise!
Answer: Re: Question1. You are right.
This does refer to the use of the Fast Fourier Transform
algorithm on the vibration page. Specifically it allows
the user to choose one of HAMM, HARR, or FLAT for the
FFT window. These refer to Hamming, Blackman-Harris, or
flat top window. This is a very technical subject and in
most cases the average user does not need to change
this. However we make these choices available for the
user who is very familiar with FFT. If this is not the
case then you can just use the default setting of
Hamming. However if you do choose to
experiment with the three possibilities then you should
be careful not to compare apples with oranges. In other
words if you are trying to compare an FFT graph from
today’s flight with a graph from last week, last month,
or last year then both should be using the same
function. Here is a link to an article on
the web if you are inclined to read more about the
window function in digital signal processing. http://en.wikipedia.org/wiki/Window_function
2. Although my mixture is properly adjusted and in the full rich position during takeoff and initial climb, I will sometimes get a fuel flow indication in the bar of my #4 cylinder - and this is before I ever touch the mixture! Moreover, I cannot seem to clear this out by pressing and holding the "Select" button. After a leaning cycle, cylinders 1-3 will clear out, but 4 will often not.
Answer: Re: Question 2. When the exhaust
gas temperature (EGT) of any given cylinder peaks the G3
saves the fuel flow rate (FF) at the instant that this
cylinder peaked. It saves a value for each of the
cylinders. This is used later to determine if a
cylinder is rich of peak (ROP) or lean of peak (LOP). If
the FF now is less than the FF when this cylinder peaked
then this cylinder is running LOP. Similarly if the FF
now is greater than the FF when this cylinder peaked
then this cylinder is running ROP. In addition to
saving this FF value the G3 also displays the FF just
below the top of the EGT bar. This lets the pilot
know what the fuel flow rate was at the instant this
cylinder peaked. This is displayed as long as the height
of the EGT bar has exceeded some threshold value.
From your log file I did notice that EGT4 is usually
hotter than the other three. See chart below.
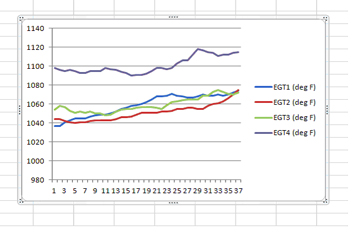
It is not unusual to have some difference between cylinders for EGT measurements. The temperature sensed depends on the position of the actual probe. Some are more exposed than others to the hot exhaust gases. Maybe because EGT4 is reading hotter than the others could be the reason you are seeing FF on EGT4 but not on EGT1 to EGT3. If you see FF on the EGT bar for cylinder #4 this is normal. If you don’t see FF for cylinders 1, 2, and 3 this could be because the height of these EGT bars is below the threshold. You can try manually increasing the height of the EGT bars to make them a bit higher than the CHT redline. To do this press the bottom button once and then turn the bottom knob clockwise. I think if you do this you will see FF for all 4 cylinders. Please let me know if this works. By the way, pressing and holding the bottom button erases the RICH/LEAN boxes but it is not supposed to erase the FF displayed below the top of the EGT bar.
20
G3
Trouble-shooting
The following is a compilation of the common symptoms
and causes of problems which may be experienced with the GEM
Systems. Close examination of these symptoms should assist
in identifying the cause of the problem.
Symptom:
The G3 series Display does not illuminate.
Cause: No
ground return at Pin 15, of the edge connector either from
the engine case or from airframe ground
Symptom:
The G3 series Display does not illuminate.
Cause:
Voltage is missing at Pin S, of the edge connector from the
circuit breaker or bus.
Symptom: One or more
columns will not illuminate.
Cause: Try recycling
power to check the Display. If all columns do not
illuminate, the GEM series display has been damaged or is
inoperative.
Symptom: One or more columns will not
illuminate. Cause:
Check the probe connections, the display will blank columns
with poor EGT and CHT connections. Columns 5 and 6 shouldn’t
illuminate on a 4 cylinder engine. Turn
top knob on G3 to the probe analysis page to check probe
Integrity. For 8 foot harness on probe analysis page
resistance should be 8 - 3 EGT / 1 - 6 CHT For 24 foot
harness on probe analysis page resistance should be 26 - 10
EGT / 4 - 18 CHT
Symptom: No EGT in one or more columns.
Cause:
Errors in harness wiring. Visually check probe connections
and polarity. Check for probe continuity at the display
connector. The resistance of the lead wire is approximately
1 ohm per foot. Take extreme care to not damage the
connector terminals with the meter probes. Turn top knob on
G3 to the probe analysis page to check probe Integrity.
Symptom: No CHT in one or more columns.
Cause:
Faulty probe. Turn
top knob on G3 to the probe analysis page to check probe
Integrity. For 8 foot harness on probe analysis page
resistance should be 8 - 3 EGT / 1 - 6 CHT For 24 foot
harness on probe analysis page resistance should be 26 - 10
EGT / 4 - 18 CHT
Symptom: No CHT in one or more
columns.
Cause: Faulty probe. Turn top knob on G3 to
the probe analysis page to check probe Integrity. For 8 foot
harness on probe analysis page resistance should be 8 - 3
EGT / 1 - 6 CHT For 24 foot harness on probe analysis page
resistance should be 26 - 10 EGT / 4 - 18 CHT
Symptom: Display goes out during engine start.
Cause:
Voltage transient or over voltage condition. The display
should not be turned on during engine start. An Avionics
Master or separate power switch should be installed to apply
power to the display.
Symptom: Display is
unstable.
Cause: Noisy or defective magneto or
ignition harness. Check operation on left and right
magnetos. The temperature should rise slowly and may
stabilize slightly or completely on one or the other
magneto. Single magneto operation will pinpoint the problem
to one ignition harness, unless both are faulty. Verify that
the probe wires and GEM series system harness are isolated
from the ignition harness. If necessary, repair or replace
the faulty ignition harness to eliminate ignition related
interference.
Symptom: Display is unstable.
Cause: Magneto ungrounded or defective P-lead. Check
ignition harness for proper shielding, grounding, and loose
spark plug caps. Check magnetos for proper grounding or
evidence of arcing. Disconnect magneto P-leads one at a
time. If this eliminates or reduces the problem, replace the
P-lead. A faulty ignition harness will typically cause all
EGT readings to "dance" up and down. The GEM series Display
will detect this type of fault long before standard test
methods, thus eliminating the potential of more serious
problems.
Symptom: Display is unstable.
Cause: Noisy or defective alternator, defective generator or
faulty ground connection. Try operation with alternator or
generator off.
Symptom: Display is affected by
radio transmissions.
Cause: Proximity of probe and/or
display unit to the radio power wiring and away from radios
and antenna coax. Check radio rack connector for missing 50
ohm matching device. The 50 ohm matching device is a thick
washer-like component part that is installed underneath the
connector end cap. The end cap will have to be unsoldered to
check for the matching device. This seemingly unimportant
component is supplied with all connectors and is required
for proper operation of the connector. Utilize
shielded-twisted pair for power leads.
Symptom: EGT indication is not uniform.
Cause:
The EGT indication for a fuel-injected engine will typically
vary a bar or two from perfectly uniform when leaned for
cruise. Clean the fuel injection nozzles. Non-uniformity is
normal in carbureted engines. All cylinders are measured by
the same circuitry. It is almost impossible to not have
identical response on all channels of the GEM series.
Symptom: A sudden or gradual reduction in the EGT
indication can be symptomatic of several engine faults.
Cause: Exhaust leaks above the probe and poor
compression due to bad rings, valves or valve guides. If a
probe substitution does not reveal a faulty probe, check for
mechanical faults in the engine. Consult the GEM series
Pilot’s Guide for more detailed engine diagnostic
information.
Symptom: All EGT readings too high.
Cause: Readjust the EGT "BAR HEIGHT" on the Display. Use
DVM a (digital voltmeter) to measure the difference between
the Display ground and engine block ground with the engine
running and the battery charging. If the difference is
greater than or 2 V DC with the alternator charging, remove
the G3 series ground and provide an extension directly to
the engine block. If this solution fixes the problem, a
ground fault exists between the engine and air-frame which
should be remedied.
Symptom: Display indicates
full scale or blanks out.
Cause: This can be
symptomatic of an intermittent ground fault between engine
and air-frame. See "All EGT readings too high".
The GEM's wiring harnesses should be positioned away from
sources of high energy,
such as ignition harnesses, magnetos,P-leads,
alternator wiring and high frequency radio wiring and antennas.
WARNING about installing probes
The minimum radius of bends in wire groups or bundles must not be less than 10 times the outside diameter of the largest wire or cable, except that at the terminal strips where wires break out at terminations or re-verse direction in a bundle. Where the wire is suitably supported, the radius may be 3 times the diameter of the wire or cable. Where it is not practical to install wiring or cables within the radius requirements, the bend should be en-closed in insulating tubing. The radius for thermocouple wire is 20 times the diameter.

Over bending voids warranty.
The first thing to troubleshoot is do I have a good ground?
How is my ground strap?
Example of good ground strap
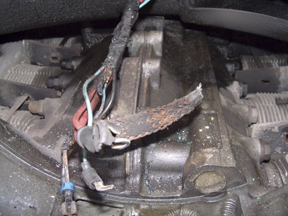
Example of a bad ground strap
If your ground strap is similar to the top picture enjoy your new G Series Engine Monitor.
If your ground strap is similar to the bottom picture you will be talking to Insight tech support.
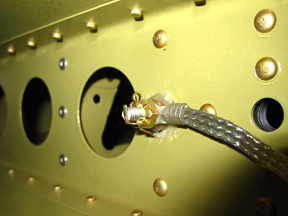
If you are having erratic fuel flow or any other function other than EGT, CHT or TIT’s please take time to inspect the wiring in the D sub connector on back of G Series monitor.
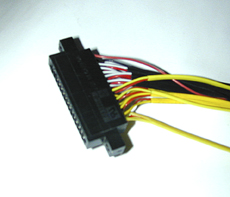
Example of good job
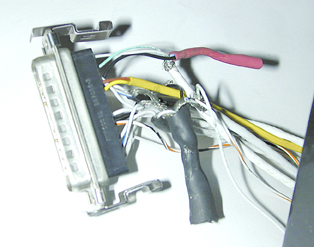
Come on, smarten up!!!
If upgrading from a previous GEM be sure to install the supplied “snap-on” ferrite suppressor over the unshielded wires.
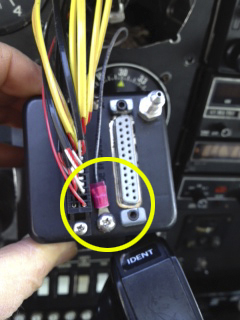
Do NOT ground the G Series monitor or any other instrument to a painted panel – Run a separate ground wire to a CLEAN airframe ground.