Vibration Answers
TECH NOTE WARNING
PLEASE READ AND UNDERSTAND DRAWINGS IF YOU DO NOT YOU WILL END UP USING THIS PAGE
This information is in the install manual
• Single Engine Vibration Install is on page 29
• Twin Engine Vibration Installs are on page 32
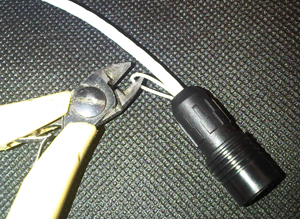
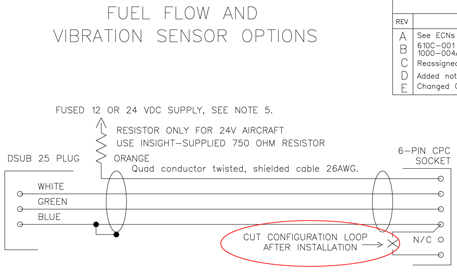
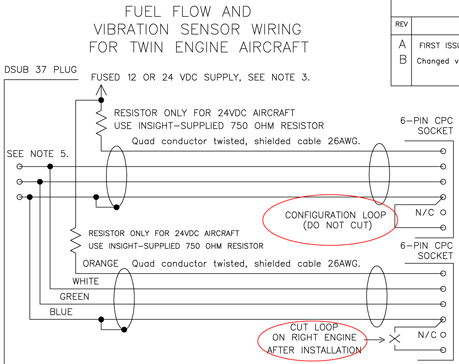
This tech note is a reminder to cut the wire loop on the vibration sensor cable connector for the right configuration on installation of the vibration sensor.
Single Engine:
Twin Engine:
If installed correctly on right engine on twin or single engine the vibe sensor LED will flash on startup.
G Series monitor will report software version of the vibe sensor.
Startup of instrument on twins, left engine vibe sensor will remain dark.
If incorrectly installed no vibe sensor LEDs will flash and will report an error message.
(Check vibration sensor on startup)
While in-flight with the vibration screen showing on G3.
Pressing and holding the PG button will trigger the G3 to save the present vibration waveform for future reference.
Hold PG button in until G3 screen says it is data logging vibration data.
To view and graph your G3 logged vibration data this Excel file will help.
Click on Excel file and follow instructions.
Insight G3 Vibration Log Graph Tool (V1.14) - Click Here
Vibration Analysis on the G3
Tech Note
Introduction:
Following the update of the G3 Graphic Engine Monitor to V1.78 or higher, the Vibration Analysis screen will now appear among the supplementary screens when the PG knob is turned. In order for the vibration analysis to function your G3 must be equipped with a vibration sensor and a connection to the magneto for RPM measurement. If your instrument was purchased prior to September 2011, Insight will be sending you a vibration sensor shortly. Instruments purchased after this date will ship with the sensor included with the main kit.
Installing the Vibration Sensor:
IMPORTANT NOTE:
Airplanes equipped with 24V electrical systems require a
750 ohm 1/2W resistor installed in line with the power
lead of the vibration sensor. This lead may be
identified as the orange/white lead that is connected to
the aircraft voltage buss. Do not install the vibration
sensor in 24V airplane without this critical component.
The sensor is connected to the G3 using a 7-pin connector included with your kit. Refer to the G3 Installation Manual, drawing number 610C-315 Option A for wiring connections. Do not forget the 750 ohm 1/2W resistor, which is not shown on earlier copies of the drawing.
After the electrical connections to the sensor are made, then sensor may be tested simply by powering up the G3 and vibration sensor. It is not necessary to start the engine to perform this test. The sensor LED should flash briefly and rapidly when power is first applied until communication is established with the G3, at which time the LED blinks more slowly (approximately once per second). When the LED indicates communications with the G3 has been established select the Vibration Analysis screen by turning the PG knob. While observing the vibration graph disregard the “RPM Required” message and rap lightly on the vibration sensor with the handle of a screw driver.
The graph should register the impacts.
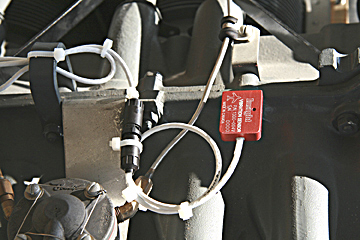
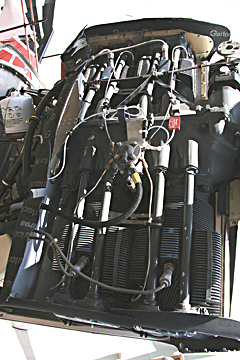
The sensor should then be firmly mounted directly to the engine case, preferably oriented in such a manner as to match the small airplane symbol engraved on the sensor body. In some rare cases it may not be possible to mount it in this manner, and the installer will have to fabricate an appropriate bracket or else be prepared to compensate for the change in orientation when viewing the vibration data.
A representative installation is shown in the following figure:
Location of vibration sensor
Using the Vibration Analysis
Screen on the G3:
The sensor detects vibration in all 3 axis (fore-aft labeled x, up-down labeled z, and left-right labeled y) which are presented on different sub-screens. The vibration analysis only functions when the engine is running and a valid rpm signal is detected.
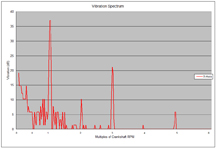
In regards to the vibration graph, the vertical axis represents the amount of vibration energy and the horizontal axis represents the frequency spectrum expressed as multiples of crankshaft rpm. When the engine is running, the screen will come alive with a waveform that represents the engine motion, presented in a spectral format with the crankshaft energies appearing at the 1x mark on the bottom scale. Propeller vibration will likewise be synchronous with the crankshaft vibration. Other sources of vibration will tend to produce energies at other frequencies. For example, camshaft vibration tends to accumulate at the .5x mark, since the cam turns at 1/2 the rate of the crankshaft. Magneto vibration will appear at 1.5x mark in a 6-cylinder engine. Alternator vibration may appear somewhere around 3x or 4x, depending on the ratio it is driven at.
A gear-driven alternator may appear in a different axis than the crankshaft does if it is mounted at 90deg to the engine, although ANY source of vibration will show some energy in all three axis. Complex vibration as generated by reciprocating machinery will also produce a great number of harmonic spikes, which at first glance may seem confusing. The user should experiment with running the engine at different power settings under different conditions to get a feel for what is a "normal" spectrum for their particular engine.
A simplified case of vibration is
shown in the following figure: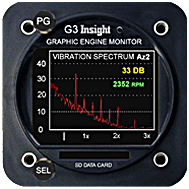
In the example shown above the main source of energy is at the 1x mark, and represents the crankshaft rpm.
The smaller spikes at the 0.5x mark and the 1.5x point are probably created by the camshaft and the magneto, respectively. The user should be aware that a multi-cylinder reciprocating engine produces energies at a multitude of frequencies and directions, which reinforce and subtract from each other to create a very complex waveform.
It is the responsibility of the user to gain familiarity with a waveform that is typical of their particular engine, so that unusual readings can be detected and interpreted.
The user may examine the various sub-screens by pushing the top button (PG). There are presently six screens to examine, each of the primary axis (X,Y and Z) and an averaged version of each (denoted Ax, Ay, and Az). The averaged version will be much "cleaner" and contain less noise than the raw measurement and is the preferred screen to examine for each axis. The bottom knob (SEL) controls a cursor which will "snap" to nearby vibration spikes to make it easy to examine them closer. The bottom knob can also be pushed to enter a zoom mode. When in zoom mode, turning the bottom knob will allow you to scroll through the waveform. Continue to press the bottom knob to set progressively higher zoom modes. A further press when at maximum zoom will return you to the overall view.
Pressing and holding the PG button will trigger the G3 to save the present vibration waveform for future reference.
The waveform will be stored as a series of hexadecimal bytes in the current log file. Insight can provide a tool for examining this waveform using Excel or a similar spreadsheet. The tool is presently in the earliest functional stages of development, and will be improved over time.
It is expected that the vibration functions will be used as a "condition-monitoring tool". Since every engine and accessory combination is different, everyone's vibration spectrum will look unique and it would be impossible to generalize the interpretation of the spectrum. The user will come to recognize what a "normal" spectrum looks like for their engine and by periodically scanning the vibration screen can recognize when potential trouble is developing. When a new spike appears or an existing spike begins to show signs of higher than normal amplitude further investigation is warranted.
The source of the spike can be interpreted by noting its primary axis and its frequency relative to crankshaft RPM as discussed above. By periodically saving their vibration data as discussed above, the user can create a database of reference waveforms for future comparison.
![]()